Customizing and Comparing P&L Reports
After the AI has analyzed your inputs, you can refine the display of your Profit and Loss statement to suit your reporting needs or client requests.
Step 1: Access Date Customization
Within the Profit and Loss tab, locate the date range and period filters at the top of the report. This is where you can define the exact window of time the AI should summarize.
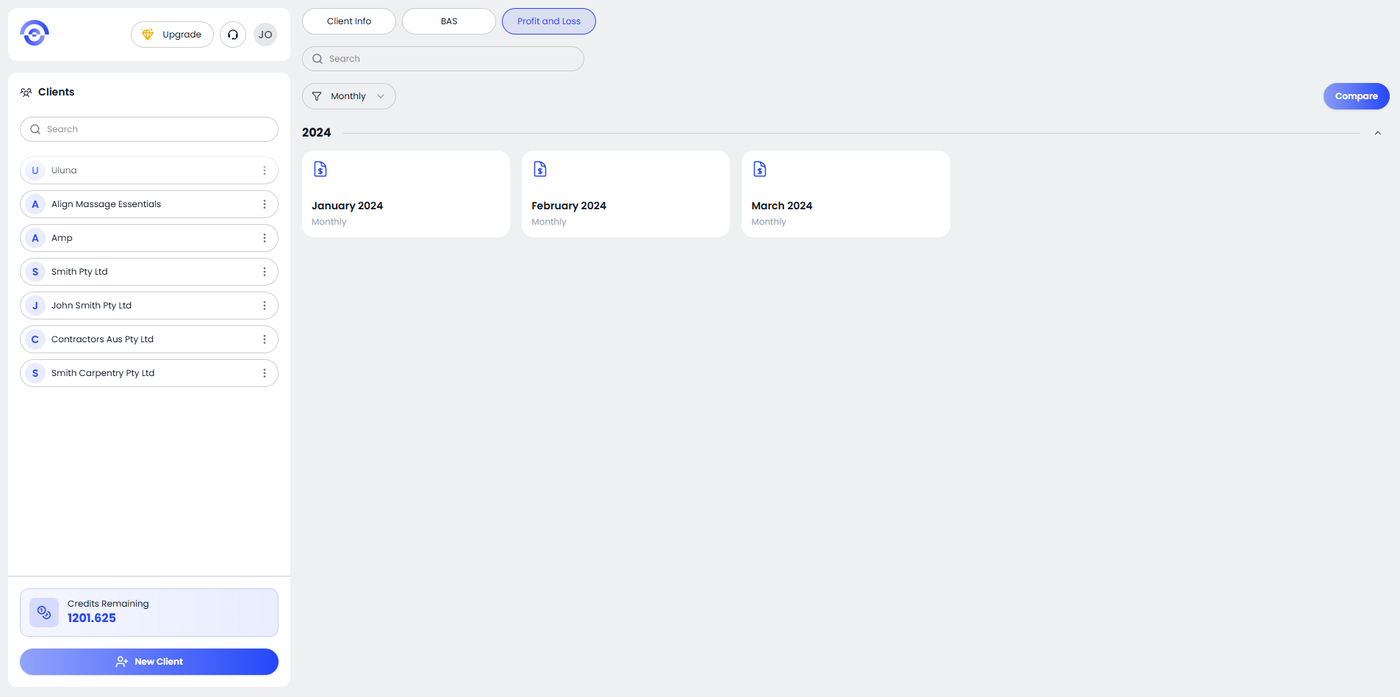
Step 2: Select Your Reporting Interval
Ezyiah allows you to break down your data into digestible chunks. You can customize the view by selecting:
Monthly: To see month-by-month performance.
2 Months (Bi-Monthly): Useful for specific internal tracking.
Current Year: Displays the P&L for the ongoing financial year (YTD).
Last Year: Instantly pulls the full data for the most recently completed financial year.
Last 2 Years / Last 3 Years: Aggregates data over a longer horizon, allowing you to see year-on-year (YoY) growth or expense trends.
Custom Dates: Set a specific start and end date for ad-hoc reporting.
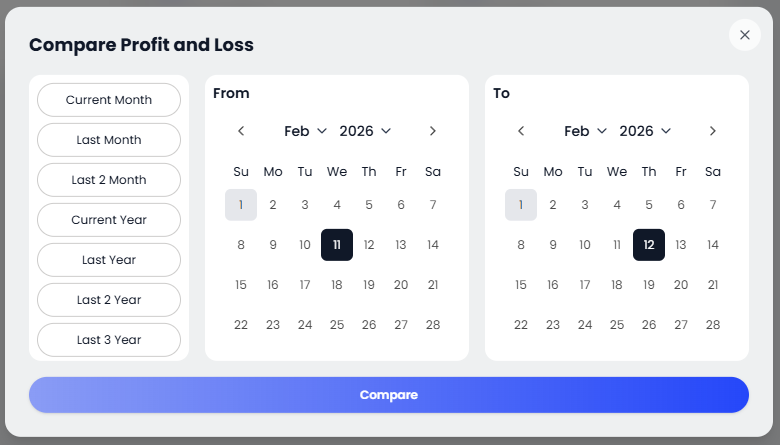
Step 3: Comparative Analysis
By adjusting these dates, you can compare different periods side-by-side. The AI instantly recalibrates the Total Income, Expenses, and Net Profit based on your selected interval. This is particularly useful for identifying seasonal trends or checking a business's health mid-quarter.
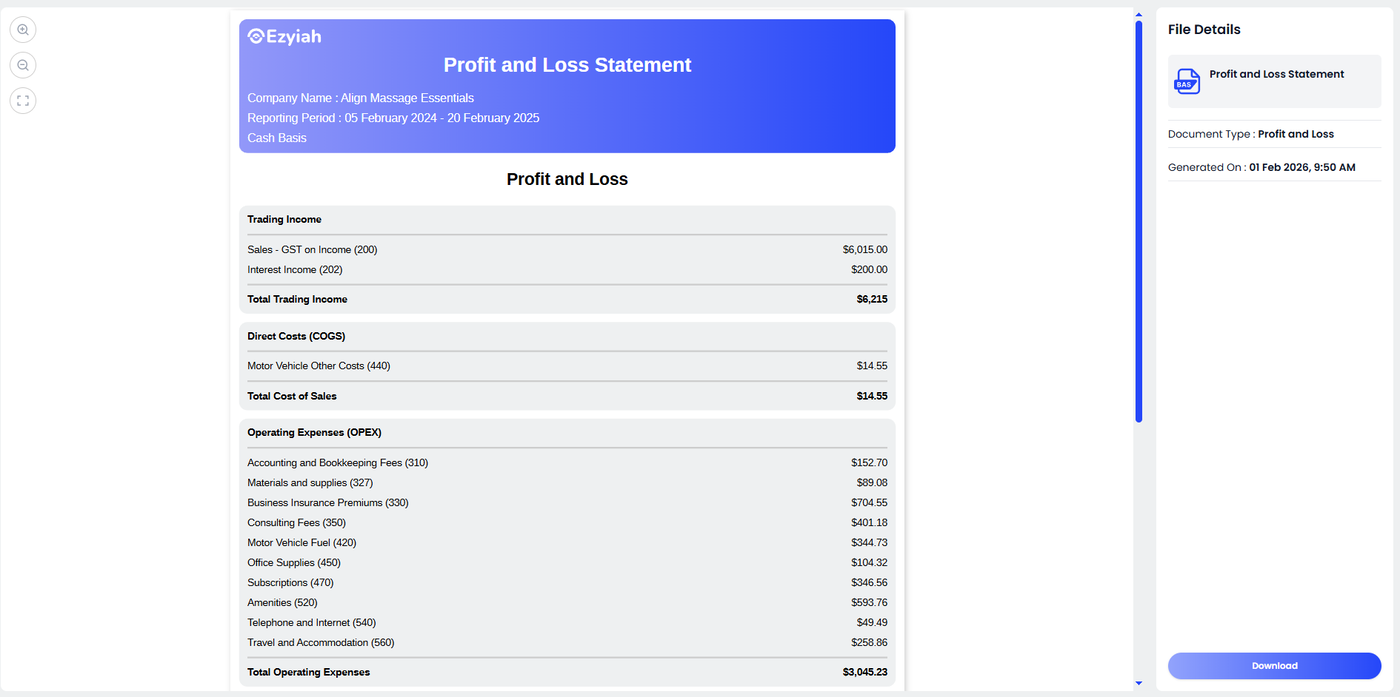
Step 4: Refresh and Export
Once you have customized the dates:
The AI will automatically update the table values.
Review the customized breakdown for any specific trends.
Click the PDF/Download icon to export this specific custom-dated report.