

Run the report
1
Open Reports
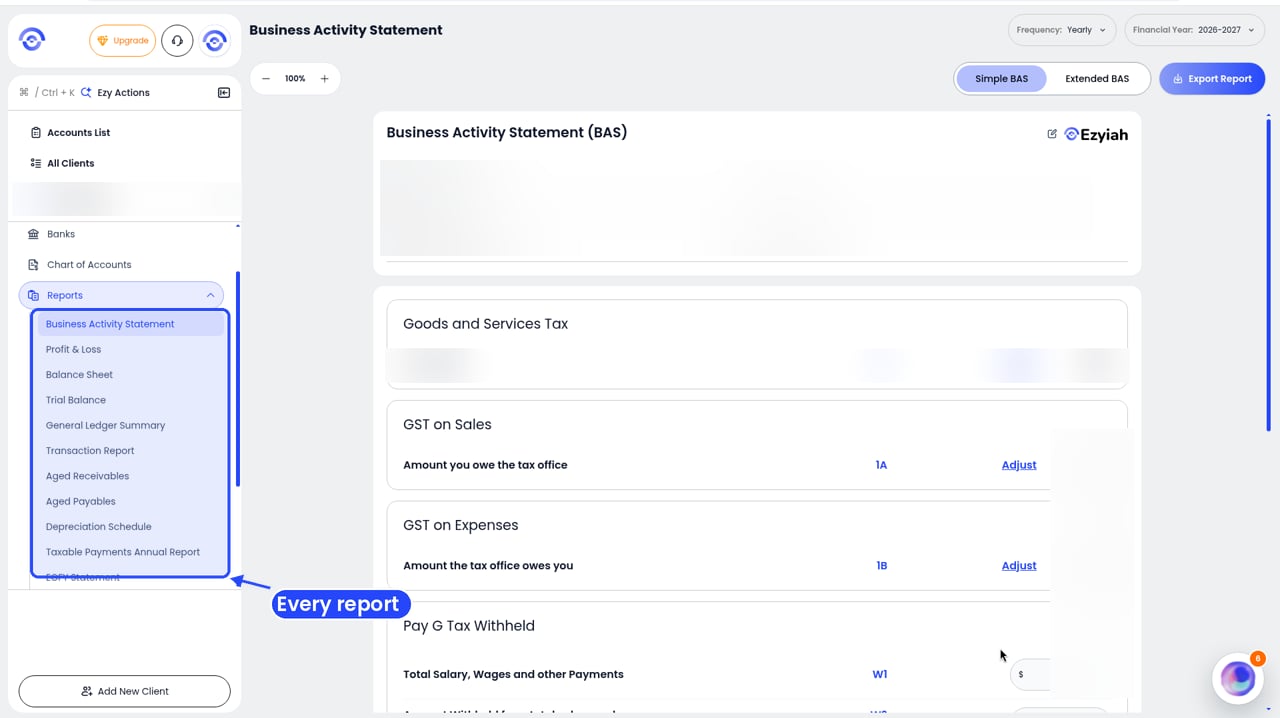
Step 1: Reports in the client's sidebar
2
Click Profit & Loss
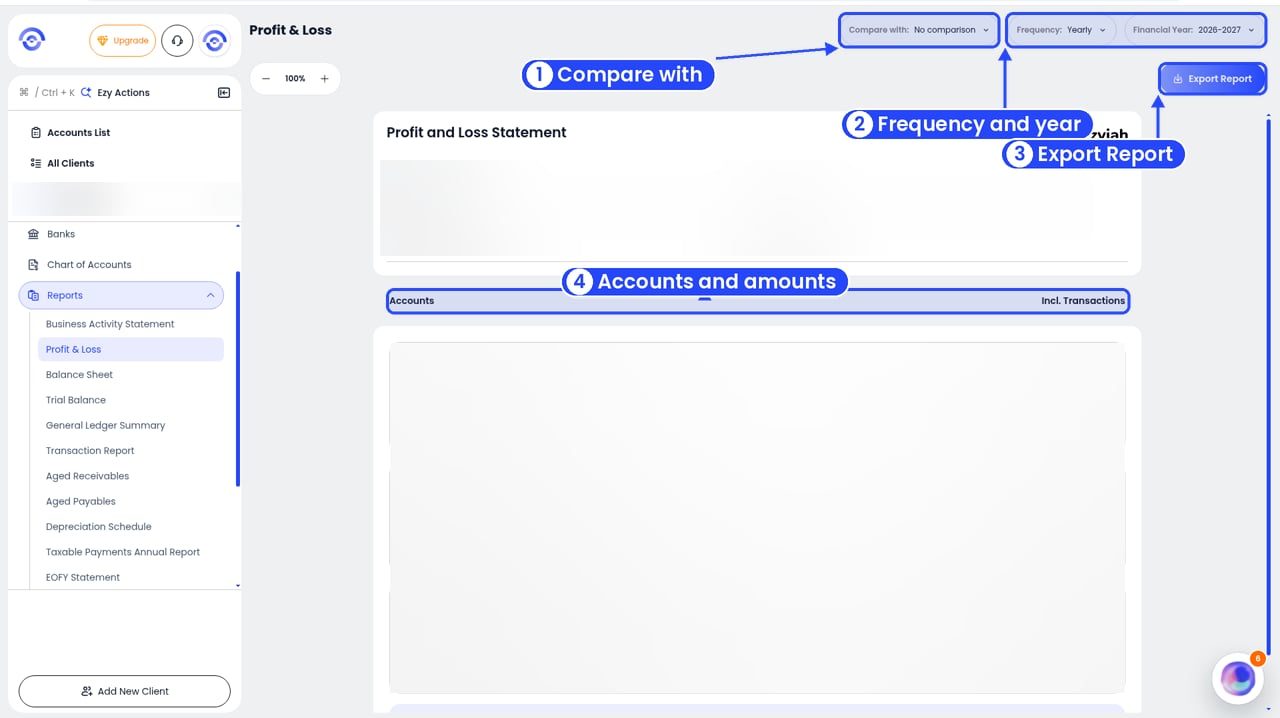
The Profit & Loss report
3
Pick the period
Use Frequency (for example quarterly or monthly) and Financial Year in the top right. To compare with another period, use Compare with.
Business owners see the same filters: Compare with, Frequency (Yearly to start) and Financial Year, plus Export Report.
Read the report
The top shows the Company Name, Reporting Period and Prepared By. The report has these sections, each with a total:- Trading Income: for example Sales - GST on Income (200) and Interest Income (202).
- Direct Costs (COGS): for example Purchases (328).
- Operating Expenses (OPEX): running costs, for example Business Insurance Premiums (330) and Consulting Fees (350).
- Suspense: transactions not sorted yet. Check these in the Chart of Accounts.