The Transaction Report uses the same groups as the Profit & Loss. It also shows how many transactions make up each total, and the GST.

Run the report

1

Open Reports
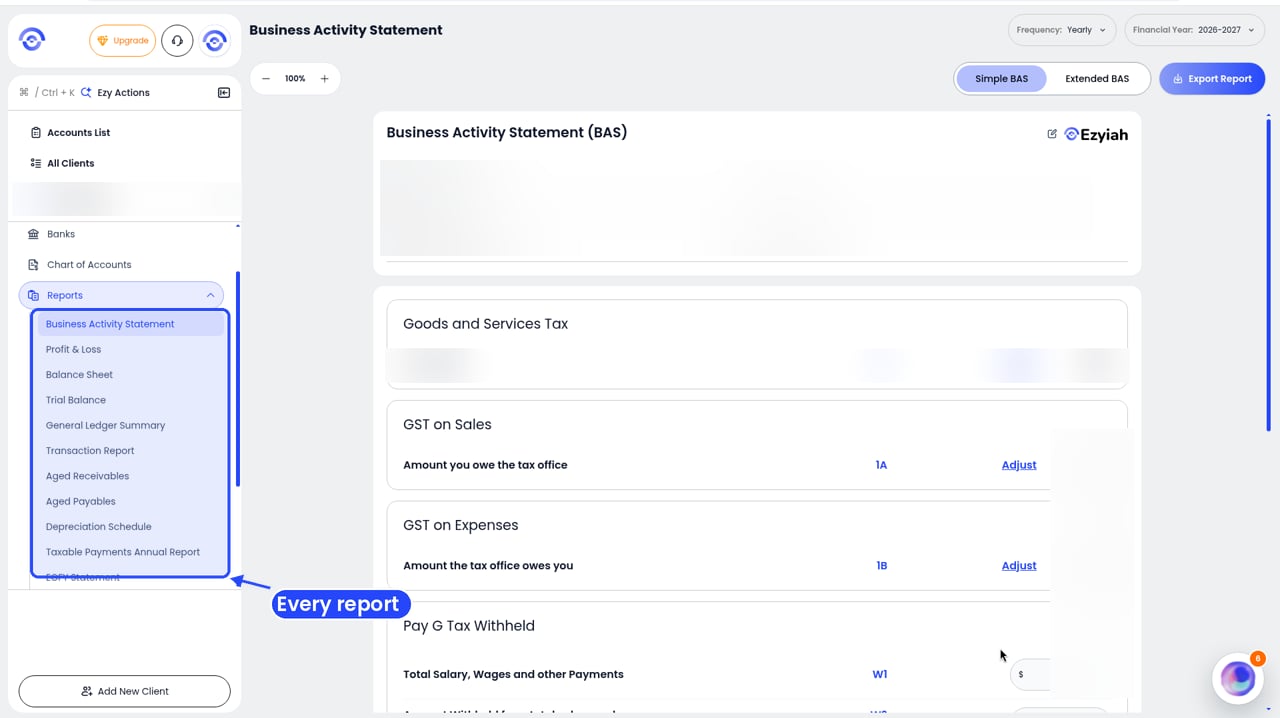
The client sidebar with Reports open, listing every report from Business Activity Statement to EOFY Statement

Step 1: Reports in the client's sidebar

Open the client and click Reports in the sidebar.
2

Click Transaction Report

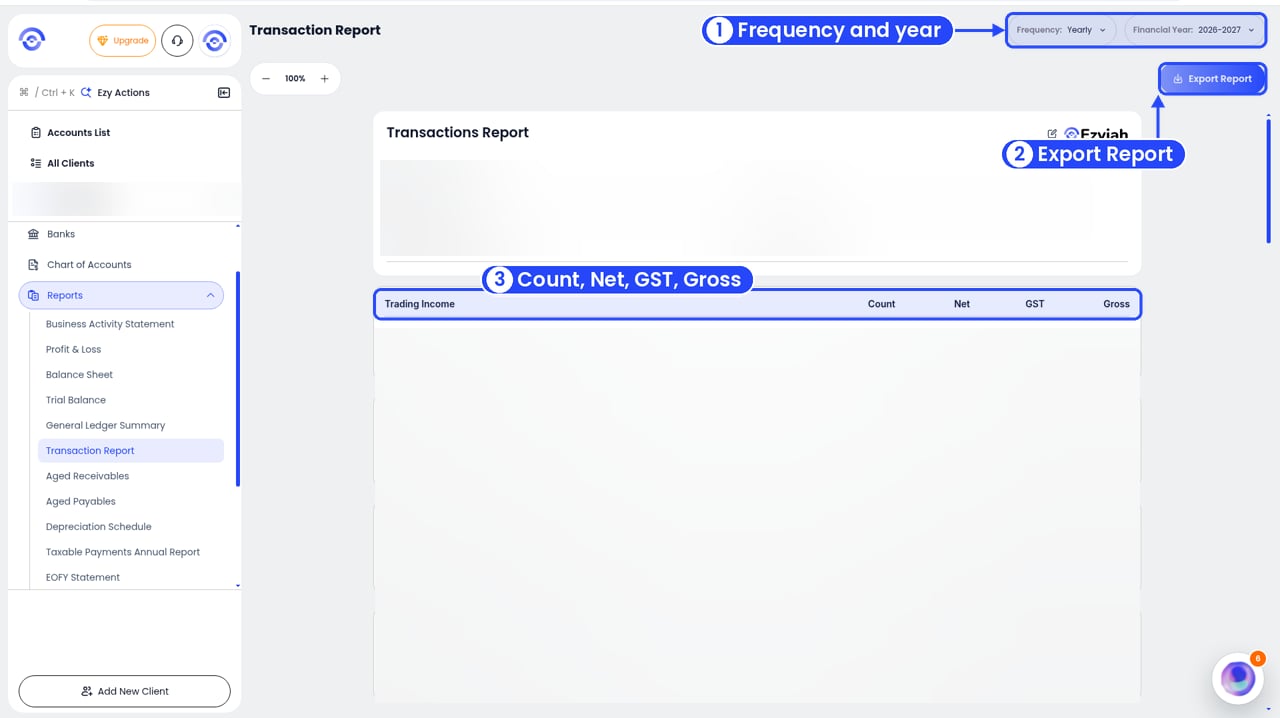
The Transaction Report with numbered callouts on the Frequency and Financial Year filters, Export Report and the column headings. Figures are blurred

The Transaction Report

Ezyiah builds the report and shows it on screen.
3

Pick the period

Use Frequency (for example quarterly or monthly) and Financial Year in the top right.

Read the report

The top shows the Company Name, Reporting Period and Prepared By. Each section has four columns: Count, Net, GST and Gross.
  • Trading Income: for example Sales - GST on Income (200).
  • Direct Costs (COGS): for example Purchases (328).
  • Operating Expenses (OPEX): for example Rates & Land Taxes (365), Depreciation (371) and Interest Charges (400).
  • Assets, Contra Assets and Unclassified, when the client has transactions there.
Each section ends with a total. In a business account, each line can also show Date, Account, Details, Bank Name, Amount, GST and Net. Click Export Report for a PDF Document or an Excel Report.
A high count with a small total, or the other way round, can point to something miscoded. Open the account in the Chart of Accounts to check.
Use the zoom buttons in the top left to resize the report. Click Export Report in the top right to download it.